Monday, December 1, 2014

How will we know when the number of Ebola infections starts to decline?


According to the World Health Organization (WHO), three West African countries continue to experience intense transmission of Ebola. More than 16,000 cases of Ebola have been reported from Guinea, Liberia, and Sierra Leone in the past several months since the outbreak started earlier this year (link). There is some evidence that the rate of new Ebola infections in these countries is not growing as fast as previously estimated which is good news. The WHO situation report published on November 26, 2014 (link) states “Case incidence is stable in Guinea, stable or declining in Liberia, but may still be increasing in Sierra Leone”.

However, there is great uncertainty over the quality of the reporting data emanating from West Africa on this Ebola outbreak. Also, based on the fluctuating numbers of newly reported cases in each of these three countries, it is difficult to assess the increases or decreases in the incidence of cases in these three countries. Assuming that the case numbers reported in the WHO situation reports are representative the number of infections in each of these countries, the average number of new cases per day can be graphed on a timeline. Below, the average number of new cases per day is compared with the cumulative moving average of cases since the start of the outbreak within each of the three countries.

These graphs clearly show that the trajectory of the number of new cases in each country generally support the WHO statement. At this time, the number of new  daily cases  in Guinea appears to be declining towards the cumulative moving average. Recent new case counts for Liberia have fallen below the long term cumulative moving average. For Sierra Leone, the reported average number of Ebola cases is above the cumulative moving average,  This is a clear indication that rate of Ebola infections in Sierra Leone have not yet started to decline.

Eventually, declines in the number of new Ebola infections in these three countries will only be apparent when the daily average of newly reported Ebola cases drops below-and stays below-the cumulative moving average. At that time the cumulative moving average will begin to decline as well. Comparing the number of daily new cases in these countries in relation to the cumulative moving daily average will help identify when there is a downturn in the number of new Ebola infections in these countries. 


Graph Notes:

1. Data used to construct these graphs is derived from the country totals provided by WHO in the Ebola situation and data updates current through November 28, 2014 (link). The new daily cases counts includes all Ebola cases reported from the country including, confirmed, probable, and suspected cases.

2. The average number of new Ebola cases per days is computed as the total number of newly reported cases since the last report divided by the number of reporting days. The average number of new cases per day is recalculated after each WHO report.

Sunday, November 23, 2014

WHO provides additional data on MERS cases from Saudi Arabia in October

Earlier this month, I noted that the World Health Organization (WHO) did not report information on five MERS cases from Saudi Arabia from October  (see Has WHO overlooked 5 MERS cases in Saudi Arabia?), although theses cases were counted in the world-wide total in the Disease Outbreak News posted on November 7, 2014 (link).

Two days ago, the WHO provided additional details about these five cases (link)  that are not available on the statistics page of the Saudi Arabia Ministry of Health website. The reporting of these additional case details is important to understanding the nature of human MERS infections.

Since, the last WHO update on MERS from Saudi Arabia (through October 30, 2014), the Saudi Arabia Ministry of Health website has reported almost 20 new MERS cases (link),. Hopefully, WHO will publish details about these cases soon as well.

Tuesday, November 4, 2014

Has WHO overlooked 5 MERS cases in Saudi Arabia?


Previously, I discussed discrepancies between the MERS case counts for the World Health Organization (WHO) and the European Centre for Disease Prevention and Control (ECDC) (link). The WHO case count differed from the number posted on the Saudi Arabia Ministry of Health website by 15 cases. At least 12 cases previously announced by the Saudi Arabia Ministry of Health had not yet been posted in Disease Outbreak News by the WHO through October 21, 2014.

Yesterday the WHO reported in aggregate 12 new MERS cases from Saudi Arabia from the period October 18 to October 26, 2014 (link). These 12 cases do not equate to the 12-case differential noted in my previous post. The most recent WHO report regarding cases from Saudi Arabia (October 16 link) only enumerates cases through October 11, 2014. However, between October 12 and October 16, the Saudi Arabia Ministry of Health website announced five additional MERS cases, Taif (3), Riyadh (1), and Al Karj (1).

Hopefully, the WHO will report these cases in the future or discuss why they are not included in the total count for MERS cases from around the world.

Links to five Saudi Arabia MERS Cases (October 12-16)


Thursday, October 30, 2014

Comparison of WHO and ECDC MERS case counts


As of October 16, 2014, the World Health Organization (WHO) reported a total of 877 cases of Middle East respiratory virus syndrome (MERS) from WHO member states (through October 11, 2014 link).  The European Centre for Disease Prevention and Control (ECDC),  a European disease monitoring organization established in 2005 (link), has reported a total of 906 MERS cases from around the world through October 21, 2014 (link). Both WHO and ECDC provide updates on the MERS outbreak, however neither these agencies provides a publicly available line list of cases.

Because it appears that the next MERS wave has started on the greater Arabian Peninsula in the Middle East, is worth discussing the apparent discrepancy in the number of MERS cases between the WHO and the ECDC.  

The table below compares the current counts of MERS cases for WHO and the ECDC through specific dates.  The differences in the case counts are discussed below by country.  WHO and the ECDC enumerate cases based on the reporting country (under IHR), rather than the source country of infection.  Also included in the table below is a column with the case counts that have been tabulated by FluTrackers.com (link). The FluTrackers’ case counts are not directly comparable to the WHO or ECDC data because the FluTrackers’ counts are based on the country of the source of infection not the reporting country.

There are minor discrepancies between the WHO case counts and the ECDC case counts as noted in the detailed discussions below. It would be beneficial if both of these organizations would make their line list of cases publicly available on the internet.
 

Discussion of table discrepancies between WHO and ECDC

Jordan

The case count noted by WHO for Jordan does not appear to include the seven retrospectively confirmed cases from the first MERS cluster in Jordan in 2012 (link).

Philippines

The WHO does not recognize any cases from the Philippines. At least two possible MERS cases have been reported from the Philippines. The first was a male nurse who tested positive for MERS in United Arab Emirates and later tested negative in the Philippines in April, 2014 (link). The second was a female nurse who was tested in Saudi Arabia and arrived in the Philippines after the positive test results were announced by Saudi Arabia (link). It is not clear which case, if either, of these two cases is included as a case from the Philippines by the ECDC.

Qatar

On October 12, 2014, the Supreme Health Council of Qatar officially announced the first MERS case in Qatar in 2014 (link), so  the WHO may report his case in the future.

Saudi Arabia

As of October 21, 2014 the Saudi Arabia Ministry of Health web page reports a total of 771 MERS cases. The ECDC count for MERS cases from Saudi Arabia is 771, matching the Saudi Arabia Ministry of Health total.

The last official WHO update prior to October 21, 2014 was published on October 16, 2014 (link). At that time, the WHO case count for Saudi Arabia was apparently 756. There is a disparity of 15 MERS  cases between the WHO case count and the ECDC case count for Saudi Arabia. This difference appears to be a function of differential reporting dates rather than major disparities in the case counts. Between  October 11 and October  21, the Saudi Arabia Ministry of Health reported a total of 12 MERS cases that will probably be reported and incorporated in the WHO count in the near future.  

This would bring the WHO total through October 21 to 768.

The reason for the difference of three cases between the WHO data and the ECDC data is uncertain. Any number of additions and deletions (due to duplicates and false positives) in the case counts could affect this differential in the case counts.

Turkey

The first MERS case in Turkey was only reported on October 17, 2014 (link). The WHO later reported this case on October 24, 2014 (link).

United Arab Emirates

It is not clear how the ECDC determined an additional four cases from United Arab Emirates compared to the WHO counts.


Wednesday, October 15, 2014

Comparing WHO and CDC Projections of Ebola Cases in the Future


Through October  12, 2014, the World Health Organization  (WHO) has reported more than  8900 cases of Ebola since this epidemic began  (link).  The outbreak is currently out of control in three countries in West Africa, Guinea, Liberia, and Sierra Leone.  The graph below depicts the timeline of the growth of the  cumulative number of total cases reported by  each of these countries.  


The overall cumulative Ebola case total time series can be fitted to an exponential growth curve to project the total number of cases going into the future. The WHO data indicate that by January  2015 there will be almost 45,000 Ebola cases as shown in the graph below.


There is no doubt now that this outbreak will not be contained in West Africa by the end of December.  How many future cases of Ebola will there be is difficult to predict. WHO has noted on several occasions that the officially reported numbers under represent the actual number of cases and deaths in these countries.

On the other hand,  The US Center for Disease Control  (CDC) has projected cases counts ranging from 550,000 to 1.4 million cases in Sierra Leone and Liberia by mid January 2015 (link).  The CDC adjusted  existing case counts by a factor of 2.5 according to their model (as of August 28, 2014).  The graph below compares the differential growth rates based on current WHO data and the estimated case count by the CDC.  According to the CDC estimates, there are now at least 22,000 Ebola cases in West Africa compared to the 8900 reported by WHO.

The graph indicates the clear disparity in the different estimates by these two health agencies of the future case count of Ebola.  As we edge closer to the end of 2014 we will have a better idea of which projection is more accurate.

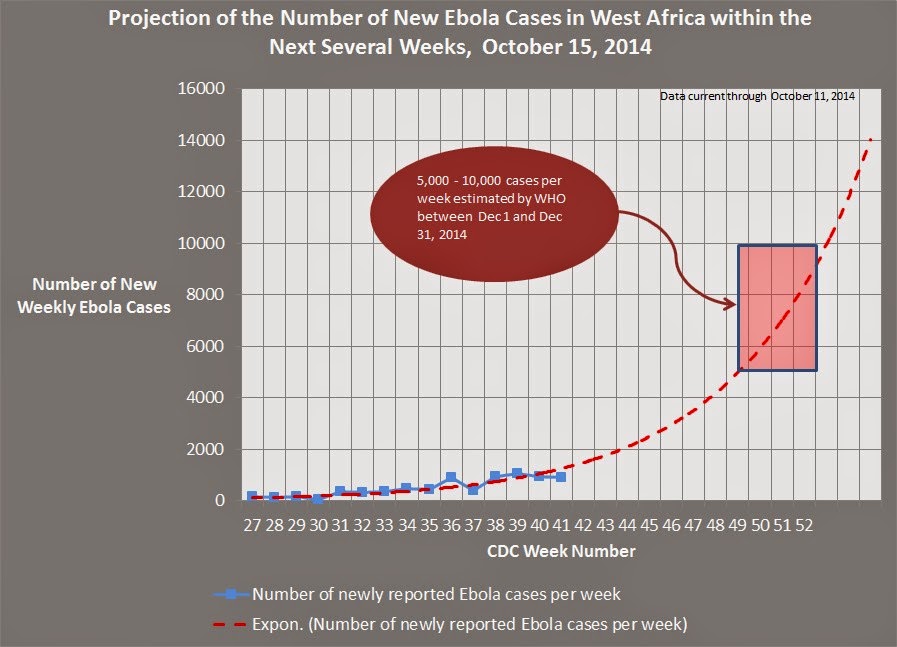
Where does the WHO estimate of 5,000 to 10,000 new Ebola cases in December come from?


The number of Ebola infections in West Africa continues to increase at an alarming rate (link).

As the official international public health agency, the World Health Organization (WHO) is tasked with tracking and reporting on infectious diseases around  the world.  As of October  14, 2014 the WHO has reported more than 8900 Ebola cases from the three West Africa nations of Guinea, Liberia, and Sierra Leone, where the Ebola outbreak has not yet been contained (link).

Below is a chart showing the continued rising number of new cases by week number in these three countries.  The data in the chart is based on official WHO data through October 12, 2014 (link).  A quote from Dr. Bruce Aylward,  a WHO spokespersonindicates that by mid December 2014 between 5,000 to 10,000 new weekly Ebola cases could reported in the three West African countries  (link).

The next graph below shows the temporal progression of the increases in new cases with a trend line projecting news cases into the coming weeks. The exponential trend line from the current  WHO data projects 5,000 to 10,000 new weekly cases of Ebola in West Africa by December 2014. This is the basis of Aylward's comments yesterday.