Monday, May 19, 2014

The First 2014 MERS Wave Peaked in Late April


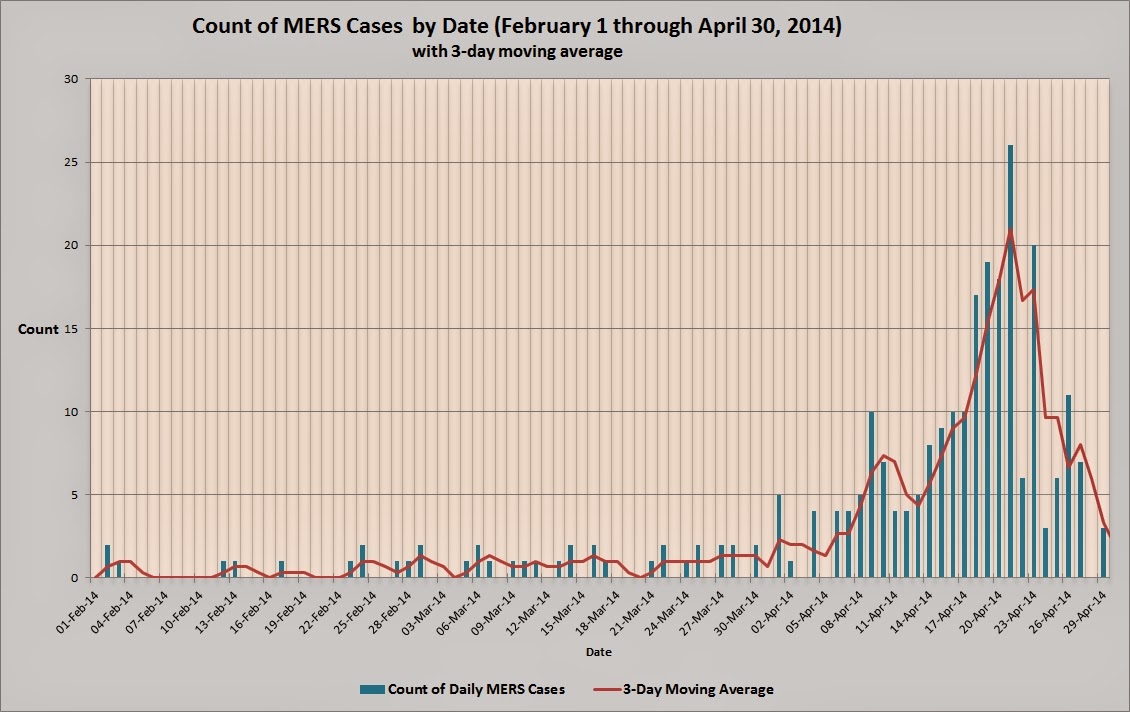
About three week ago, I posted a graph that suggested the first wave of Middle East Respiratory Syndrome (MERS) infections in 2014 peaked about April 20th and was starting to decline (Number ofCurrent MERS Infections on the Arabian Peninsula May Be Declining).

Since April 30 almost 200 additional MERS cases have been reported. Extending the graph to include data through May 17, the additional data clearly show that the number of MERS cases (based on the plotting criteria) started to decline about April 20 and has continue to decline since then. The date associated with each individual case varies with the publicly available information. Where possible, the onset date is used. If the onset date is not provided, the date of hospitalization is used or the date of death. If the case is asymptomatic, the date of confirmation is used if available, if not, the date of the official report is used. If no other calendar information is available, the date of the report is used.  Importantly, the distribution of these additional cases by onset date, hospitalization or death date, or date of report, did not appreciably alter the shape of the graph or shift it closer in time. The plotted 5-day central moving average (incorporating all of the additional cases) is almost coincidental with the moving average plotted through April 30 as show on the graph below. 


Since most MERS cases are being reported from Saudi Arabia, the decline in cases is welcome news.  However, the number of exported MERS cases from Saudi Arabia to other countries seems to be increasing and should of concern for public health officials worldwide.


World Map of the MERS Outbreak through May 18, 2014


More than 650 cases of Middle East Respiratory Syndrome (MERS) have been reported from around the world by official national and international public health agencies in 20 countries through May 18th, 2014.  These countries are the highlighted countries in map below.  This is more than a three-fold increase in countries reporting MERS cases in the last year. In May of 2013, only six countries, France, Germany, Jordan, Saudi Arabia and Tunisia, and the United Kingdom had officially reported MERS cases.


The next map depicts the geolocation of both imported cases and local infections of MERS in Europe, North Africa, and the Middle East.  The MERS cases included on this map include both confirmed and probable/suspected cases.   The size of the circles represents the relative number of MERS cases at each location.  Saudi Arabia has reported the largest number of MERS cases;  more than 80% of all the MERS cases in the world have occurred in Saudi Arabia.  

Wednesday, April 30, 2014

Map: Geolocations of MERS Cases in Saudi Arabia in the Last 3 months, April 30, 2014

About 215 MERS cases have been reported in Saudi Arabia since February 1, 2014, from 8 geographic areas of the country.

Tuesday, April 29, 2014

Number of Current MERS Infections on the Arabian Peninsula May Be Declining


Since January 1, 2014, about 250 cases of MERS infection have been reported by various public health agencies and official media outlets. The number of reported cases began to increase dramatically about the 9th of April. Most of these cases (about 200) have been reported from the Kingdom of Saudi Arabia.

The graph below suggests that the number of MERS cases may have peaked about April 20, and the outbreak is now being better controlled.


 Notes: The date of onset for an individual case is used where available. If onset date is unavailable, the date of hospitalization or death is used. If the case is reported as asymptomatic or no other information is available, the date of report of the case is used.

Monday, April 21, 2014

Map Showing the General Locations of MERS-CoV Cases on the Arabian Peninsula (April 21, 2014)


Map of the general geolocations of more than 330 local MERS-CoV infections on the Arabian Peninsula as of April 21, 2014. Locations with 10 or more reported cases are labeled in black. The area of the circle depicts the relative number of reported cases at that location.  


Reported Geolocations with 10 or More MERS-CoV Cases 
Geolocation Case Count (as of April 21, 2014)
Riyadh 100
Jeddah 73
Abu Dhabi 29
Al Hofuf 26
Ash Sharqiah 17
Al Ain 15
Hafar Al-Batin 11
Madinah 11